
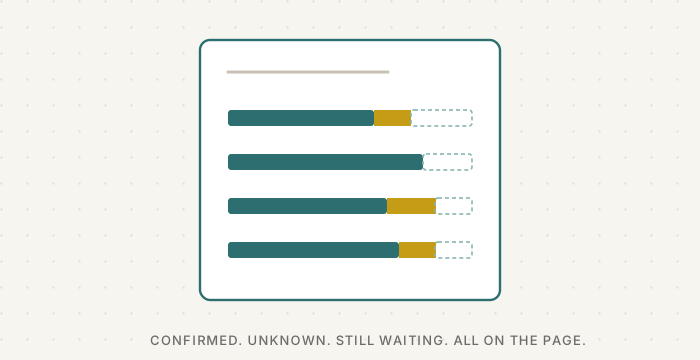
How to really do quality · a guide in three parts
- Part 1. Build the system
- Part 2. Run it every week
- Part 3. Review it and improve
In ISO 9001, the quality standard most quality managers work with, the management review is the moment the leaders look at the evidence and decide. Everything in parts 1 and 2 exists to feed this moment.
Below is the structure I would use. Eight sections, two pages. After it, a worked example with invented numbers, so you can see every calculation.
The report: eight sections
- Everyone accounted for. Where every person who came to you is now.
- Our promises in numbers. Three to five promises, each as X of Y.
- What the audit found. Nonconformities, observations and good practice from the cases you traced.
- What went wrong, and what we did. Your log, with all four moves.
- What people told us. Feedback and complaints, and who did not answer.
- Outcomes, with the missing shown. What changed for people, and what you don't know.
- Partners and resources. Handovers to other organisations, staff time, and what this report cost.
- Decisions we need. What you are asking the board to decide.
The worked example
Everything here is invented. One made-up service, one quarter, July to September 2026. Look at the method, not the figures.
1. Everyone accounted for
240 people contacted the service. Before any percentage, show where each one is. The easiest way is to follow everyone through the eligibility decision.
| Eligibility decision | People | Where they are now |
|---|---|---|
| Output: accepted | 120 | 100 started, 12 waiting to start, 8 declined the offer |
| Output: not eligible | 40 | Included in case checks and feedback |
| Output: referred to a better-placed service | 30 | Included in referral checks |
| Exit: left before the decision | 20 | Asked why, gently |
| Step still open: no decision yet | 30 | 20 past the deadline, 10 not yet |
| Total | 240 | Nobody missing |
Look at the labels. The first three rows are the three outputs of one step. The fourth is an exit. The fifth is a step that has not finished. All five must be visible, or the total will not add up.
This table does more for trust than any other part of the report. It says: we know where everyone went.
2. Our promises in numbers
| Promise | X of Y | Result | Still open |
|---|---|---|---|
| Real answer within 3 working days | 176 of 220 | 80% | 16 still waiting, oldest 18 days |
| Decision within 10 working days | 144 of 180 | 80% | 20 overdue |
| Every referral made: arrival confirmed | 52 of 80 | 65% | 12 waiting, 6 declined, 10 unknown |
| Progress review done on time | 70 of 100 | 70% | 15 late, 15 not done |
Each row has its own Y. They overlap, so never add them together.
Under the first row, one sentence: "Typical wait 2 working days. Slowest tenth 11 days or more. Oldest open request 18 days."
And one sentence about trends: "Referral arrival rose from 56% last quarter to 65%. Two points are not a trend yet. We will keep watching."
3. What the audit found
"We traced 10 random cases and 5 chosen on purpose through every step. In the random cases, the most common nonconformity was a referral with no record of arrival (4 of 10). In the cases chosen on purpose, 2 of 3 "not eligible" decisions were wrong. One observation: first-contact answers depend on one colleague's own reminder list."
When we followed this up with a bigger check, 4 of 20 "not eligible" decisions were wrong. One in five. That goes to the top of the decisions, however good the other numbers look.
Notice what is not here: one overall "decision accuracy" percentage. Refusals were checked more heavily on purpose. Mixing them with acceptances into one number would give a figure that means nothing. So report them separately.
4. What went wrong, and what we did
Show the log in two columns. Never one.
- Changes made: 4 of 6 due this quarter. 2 are late.
- Changes shown to work: 2 of 3 due a check. 1 not tested yet.
Example of one that worked: decision letters were missing how to ask for a review. Before the change, 8 of 40 letters checked had the gap. After, 0 of 40. Five people we asked could explain how to ask for a review. A good early sign. Not proof it will never happen again.
5. What people told us
"We asked 200 people from every route. 120 answered. 90% felt treated with respect. Only 70% knew what would happen next. Only 45% of refused people answered, against 64% of everyone else, so their experience is probably underrepresented."
Next to it, a few short stories. Two good, two mixed, two bad. For each one, write why you chose it. Stories explain. They do not measure.
6. Outcomes, with the missing shown
An earlier group of 60 people was due a check three months after support. 45 were reached. 36 met the goal they set. 9 did not. 15 are unknown.
| What we say | Calculation | What it means |
|---|---|---|
| How many we know about | 45 of 60 = 75% | A quarter of the group is unseen |
| Goal met, among those reached | 36 of 45 = 80% | Says nothing about the missing |
| Goal met, confirmed for the whole group | 36 of 60 = 60% | The honest minimum |
| Widest possible range | 60% to 85% | If all 15 unknown failed, or all succeeded |
What you can say: "36 people are confirmed to have met their goal after our support."
What you cannot say: "Our service has an 80% success rate." Or: "Our support caused this."
The word that matters is after, not because. To claim cause you need an evaluation, ideally by someone outside your organisation. Most organisations will honestly say "we delivered it, and this followed". That is not weak. It is true.
7. Partners and resources
"Of 80 referrals, one partner accounts for 7 of the 10 unknown arrivals. We will raise this with them and with our funder."
"The funder verified our last claim. 3 of 140 cost lines were disallowed, all for missing proof of payment. From this quarter, a second person checks every cost line before a claim goes out."
"This report took 60 hours of staff time against 3,000 hours of service. About 2%." Always show the cost. A quality system that eats the service it should protect has failed.
8. Decisions we need
Order them by harm, not by size. The longest queue here is slow first answers. But the wrong refusals come first, because of what they cost the people affected.
- Approve re-checking all 40 refusals from this quarter within 20 working days.
- Approve a named owner for all service documents.
- Decide how to close the language-support gap: 60% answered on time for people who needed language help, against 86% for everyone else.
- Agree to raise the referral partner issue with the funder.
- Approve the updated control plan: a second person checks every "not eligible" decision for the next two quarters. And the updated process map, version 2, dated today.
The review meeting: one hour
- Last time's decisions (10 minutes). Done? Shown to work? This is always first. It is how you know the system is real.
- Everyone accounted for, and the promises (15 minutes). Questions only. No defending.
- Case findings and the log (15 minutes). Look for what repeats.
- Decisions (20 minutes). For each one: what changes, who owns it, by when, and how we will know it worked.
The minutes are one line per decision. Next quarter, item 1 of the meeting is those lines.
The cycle, in four lines
Quality managers call it Plan, Do, Check, Act. You have already done all four.
- Plan: the process, the owners, the promises and the critical steps. Part 1.
- Do: your normal work, leaving records, with the control plan running.
- Check: measures, audits, feedback. Part 2.
- Act: the review and its decisions. This part. Then back to Plan.
The first cycle is the hardest. The second takes half the time. By the third, the report almost writes itself, because the system is producing it.
Using it with your board, your funder and your annual report
Your board. This report is the board paper. Two pages, every quarter, the same eight headings. After a year, the board can see the line move.
Your funder. You will still fill in their form. That does not change. What changes is that every number on it now has a source you can show. And you can add one sentence funders rarely see: "Here is what we know, what we don't, and what we are fixing."
Your annual report. If you are a registered charity in Ireland, you file an annual report with the Charities Regulator. Keep your stories in your published annual report. Put the "everyone accounted for" table next to them. It makes your stories more believable, not less.
Public versions. In anything published, show small counts from 1 to 4 as "fewer than 5". Small numbers can identify real people.
The people you serve. Make a short plain version for them too: what we promised, how we did, and what we changed. A process you can explain to your board but not to the person going through it is not finished.
Checklist for part 3
- Two pages, eight sections, the same every quarter
- Everyone accounted for, before any percentage
- Every number as X of Y, with what is still open or unknown
- Changes made and changes shown to work, in two columns
- Outcomes with three numbers, and "after", never "because"
- The cost of the report, in hours
- Decisions ordered by harm, each with an owner, a date and a test
- Next meeting starts with last meeting's decisions
What to avoid when you report on quality
- Percentages without the base. Say "36 of 60", not "60%".
- Counting only what got done. Y is everyone who was due.
- The words "impact" and "because of us" when you only have monitoring. Say "after", not "because".
- One overall quality score, where a wrong refusal disappears.
- Only good stories. For each story, say why you chose it.
- Hiding what you don't know. Unknown results belong in the report.
- The words "compliant" or "verified" until someone outside has confirmed it.
Quality is not a document. It is the habit of keeping promises and checking them. The report is just the place where everyone can see it. We learn in public, so others can trust our growth.
Let the report come from the map
When the process, the owners and the promises live in one place, the report stops being a rewrite every quarter. Start free with one service.